Chapter 11 — Consumer and Producer Surplus
Cambridge International AS & A Level Economics (9708) · Unit 2.5 · 4th edition coursebook
Learning objectives
- Explain the meaning and significance of consumer surplus.
- Explain the meaning and significance of producer surplus.
- Explain the causes of changes in consumer and producer surplus.
- Analyse the significance of price elasticity of demand and supply in determining the extent of changes in consumer and producer surplus.
Key terms
- consumer surplus
- The difference between the price a consumer is willing to pay and the price actually paid.
- producer surplus
- The difference between the price a producer is willing to accept and the price actually received.
11.1The significance of consumer surplus
As explained in Chapter 7, the demand curve shows the maximum price consumers are willing to pay for different quantities of a product. Those who get most satisfaction will be willing to pay a higher price than those who get less. For most products, however, the price is given — firms cannot charge each consumer the maximum they would individually be willing to pay.
Consumer surplus is the difference between what consumers are willing to pay and what they actually pay. On the demand-and-supply diagram (Figure 11.2), consumer surplus is the shaded area above the market price line P and below the demand curve, up to the equilibrium quantity. Some consumers would have been willing to pay as much as P₁ but only have to pay P — the difference between P₁ and P, summed over all consumers, is the total consumer surplus.
A fall in market price raises consumer surplus. The increase comes from two sources: existing consumers now pay less than before, and new consumers are drawn into the market by the lower price. Figure 11.3 shows both effects: the rectangle to the left of the original quantity captures additional surplus for existing consumers; the triangle to the right captures consumer surplus for new buyers brought into the market.
The magnitude of the change in consumer surplus depends on the price elasticity of demand. Figure 11.4 contrasts the two cases. Where demand is inelastic (panel a), a given price rise produces only a small loss in consumer surplus, because quantity demanded barely falls. Where demand is elastic (panel b), the same price rise produces a much larger loss in consumer surplus, because the quantity bought falls sharply.
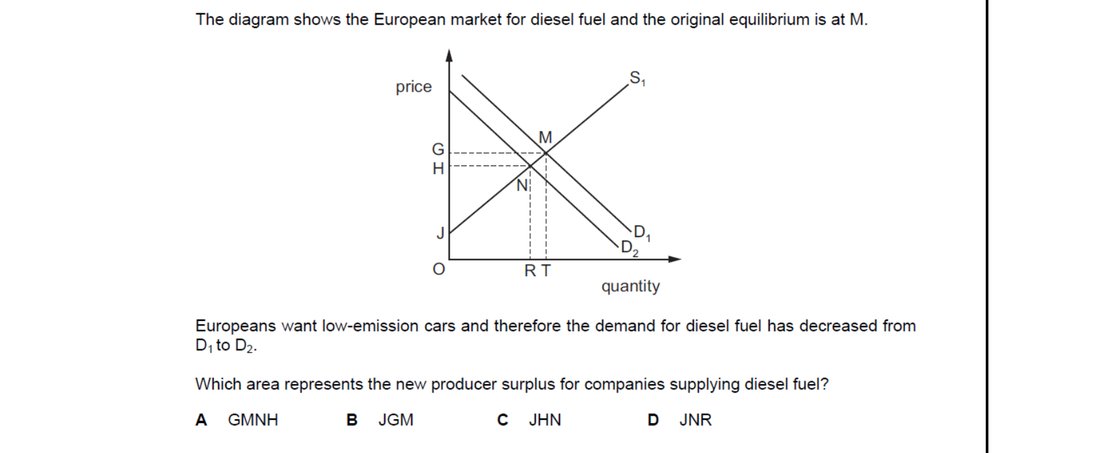
Producer surplus is the area above the supply curve and below the price actually received, up to the quantity traded. After demand falls from D1 to D2, the new equilibrium price drops and quantity is lower. The new producer surplus is the triangle bounded by the supply curve, the new lower price line and the price axis. Option C – area JHN – matches this smaller triangle.
11.2The significance of producer surplus
Producer surplus is the mirror image of consumer surplus on the supply side. The supply curve shows the minimum price a producer would accept to supply each additional unit. The market price is usually above this minimum, so producers earn a surplus equal to the difference between what they receive and what they would have accepted. On the diagram (Figure 11.5), producer surplus is the area below the price line P and above the supply curve, up to the equilibrium quantity.
When market price rises, producer surplus increases. The increase comes from two sources: existing producers receive more per unit, and new producers are drawn into the market who were previously unwilling to supply at the lower price. The size of the change depends on the price elasticity of supply: where supply is inelastic, a given price rise produces only a small gain in producer surplus; where supply is elastic, the same price rise produces a much larger gain (Figure 11.6).
Net benefit to society
At the market equilibrium, the sum of consumer surplus and producer surplus is the net benefit to society — the total welfare generated by trade in this market. In Figure 11.7, CS is the triangle AEP and PS is the triangle PEB. Together they form the triangle AEB, the total welfare generated. The competitive equilibrium is the point at which this combined surplus is at its maximum: any deviation away from equilibrium (a tax, a price ceiling, a monopoly restriction) reduces the combined surplus and creates what economists call a deadweight loss — a measure of the resulting inefficiency.
Key concept link — efficiency and inefficiency
A market is efficient when the sum of consumer and producer surplus is at its maximum. Any intervention or restriction that pushes the market away from competitive equilibrium reduces total surplus and creates inefficiency.
Over-consumption typically signals a market failure where consumers are unaware of full costs or benefits. Option D – imperfect information – means buyers cannot weigh true costs (or harms) of consumption, so they consume more than the socially optimal quantity. Option A simply describes welfare distribution, B implies under-consumption, and C describes a different disequilibrium (surplus).
End-of-chapter practice
Past-paper questions from CIE 9708. Pick A, B, C or D. Answers are saved on this device — press Download report (PDF) at the top to save them.
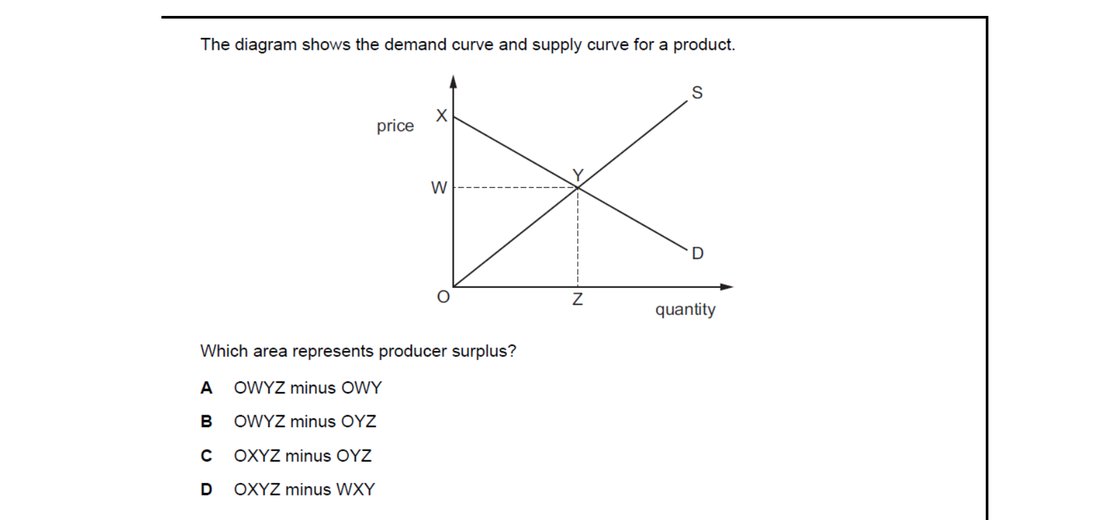
Producer surplus is the area below the equilibrium price line and above the supply curve up to the quantity traded. Geometrically that is the area of the rectangle OWYZ minus the triangle OYZ under the supply curve. Option B captures this subtraction. The other combinations either include consumer surplus or carve out the wrong triangle.
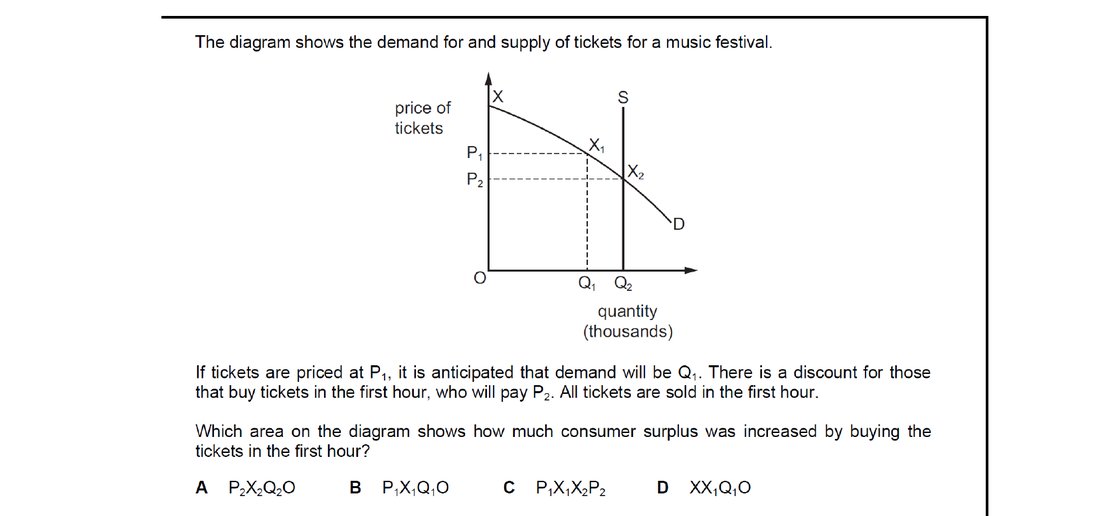
Buying early at the lower price P2 instead of P1 saves (P1 - P2) per ticket for every ticket bought, on Q1 tickets. The extra consumer surplus is therefore the rectangle bounded by P1, P2 and the quantity Q1 – namely P1X1XP2. Option C identifies exactly that rectangle, while the others include either total spending or areas outside the price-saving region.
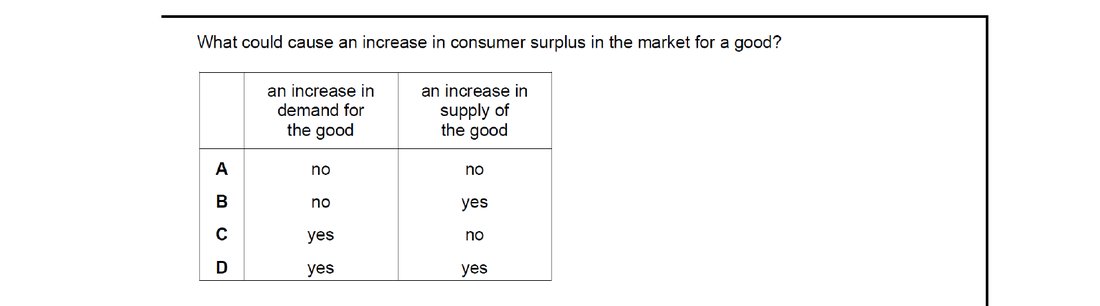
Consumer surplus rises when price falls or when buyers face more attractive offerings. An increase in demand alone raises price (often reducing CS), while an increase in supply lowers price and increases CS. Option B – no demand rise, but supply rises – is the change most likely to increase CS unambiguously through a lower equilibrium price.
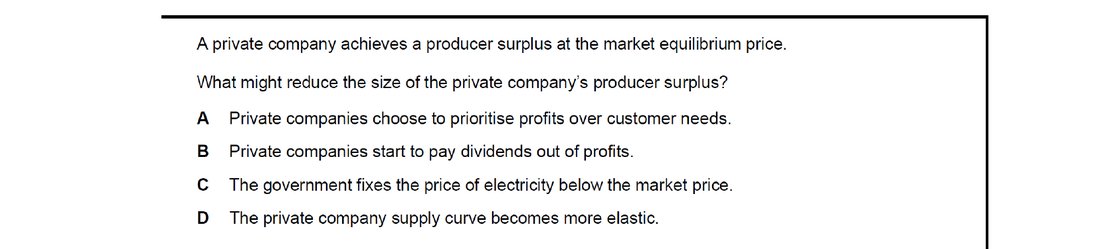
Producer surplus equals the gap between price received and minimum acceptable price, summed over output. Option C – a government-imposed price ceiling below the market price – cuts both price and quantity, squeezing the supply triangle and shrinking PS. Options A and B affect profit distribution rather than PS, and D actually widens PS for a given price rise.
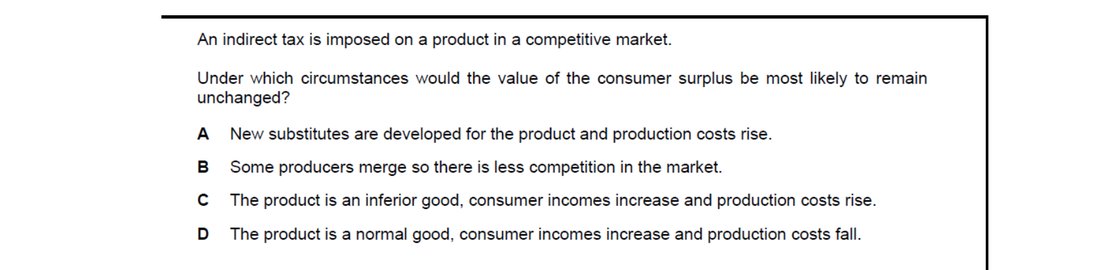
Consumer surplus would be unchanged only if effects on demand and price cancel out. Option D – a normal good with rising incomes (which raises demand) and falling production costs (which raises supply) – can leave equilibrium price roughly unchanged while quantity rises, so CS may stay similar in shape. The other combinations clearly shift price up and shrink CS.
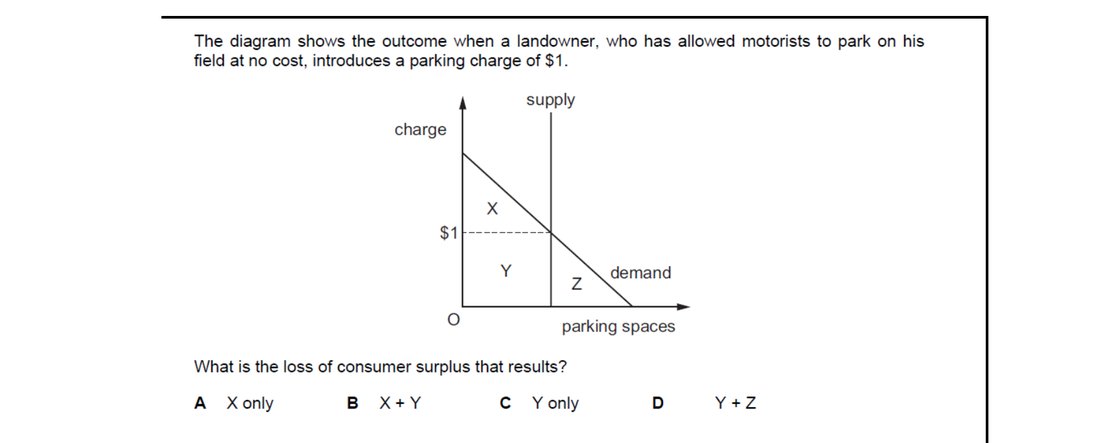
Originally parking was free, giving consumers a surplus equal to the whole triangle below demand. After a $1 charge, some motorists stop parking. Area X is now revenue paid to the landowner (a transfer, not a deadweight loss), while area Y is the welfare lost on units no longer consumed. Option C – Y only – isolates the pure deadweight loss component the question labels as the loss of consumer surplus.
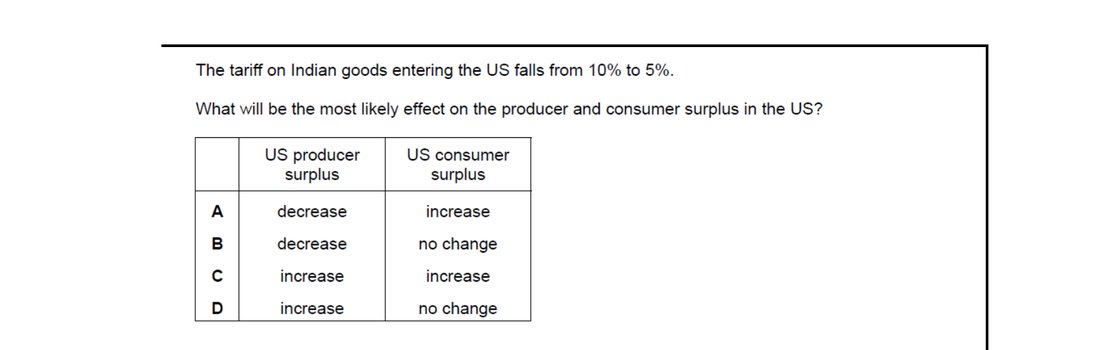
A tariff cut from 10% to 5% lowers the price paid for Indian goods in the US market. US domestic producers face stronger import competition and see their producer surplus fall, while US consumers enjoy lower prices, increasing consumer surplus. Option A – US producer surplus down, US consumer surplus up – correctly captures both directional effects.
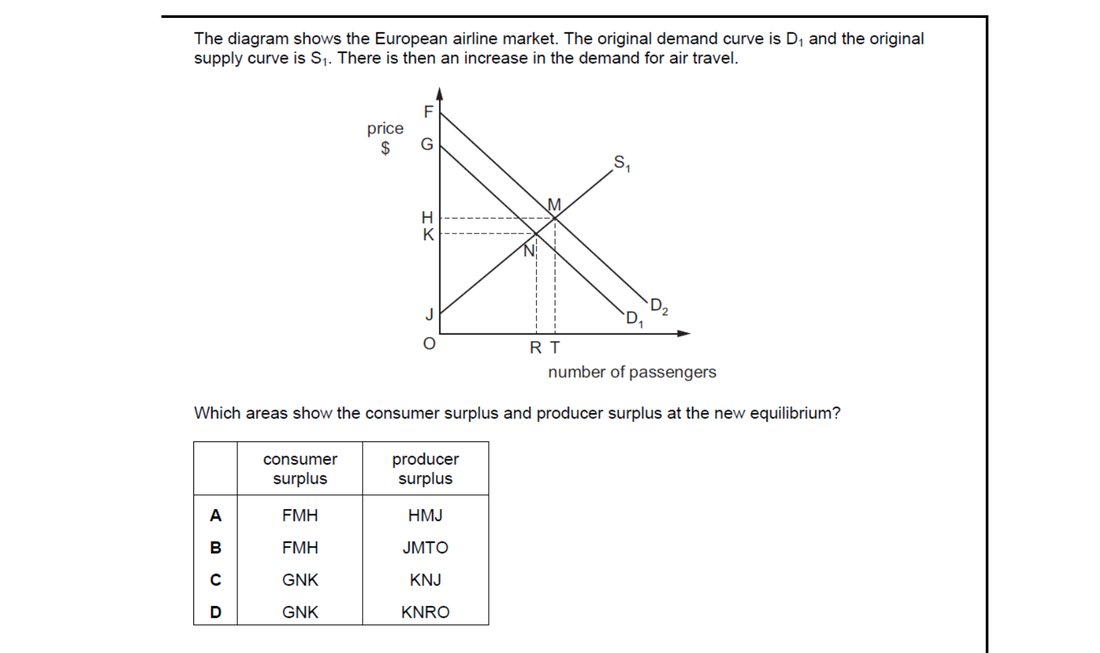
After the demand increase, the new equilibrium price is higher and the quantity larger (intersection at point N). Consumer surplus is the triangle above the new price and below the new demand curve – area GNK – while producer surplus is the area above the supply curve and below the new price – KNRO. Option D matches both areas correctly.
Attempt the practice questions above to build your score.
Self-evaluation checklist
After studying this chapter, you should be able to:
- Define consumer surplus and producer surplus and identify them on a diagram.
- Explain why a price change alters CS and PS, and how PED/PES affect the magnitude.
- Identify the net benefit to society at competitive equilibrium and recognise efficiency at this point.
Want more practice? Drill this chapter's past-paper MCQs (75 questions) →